


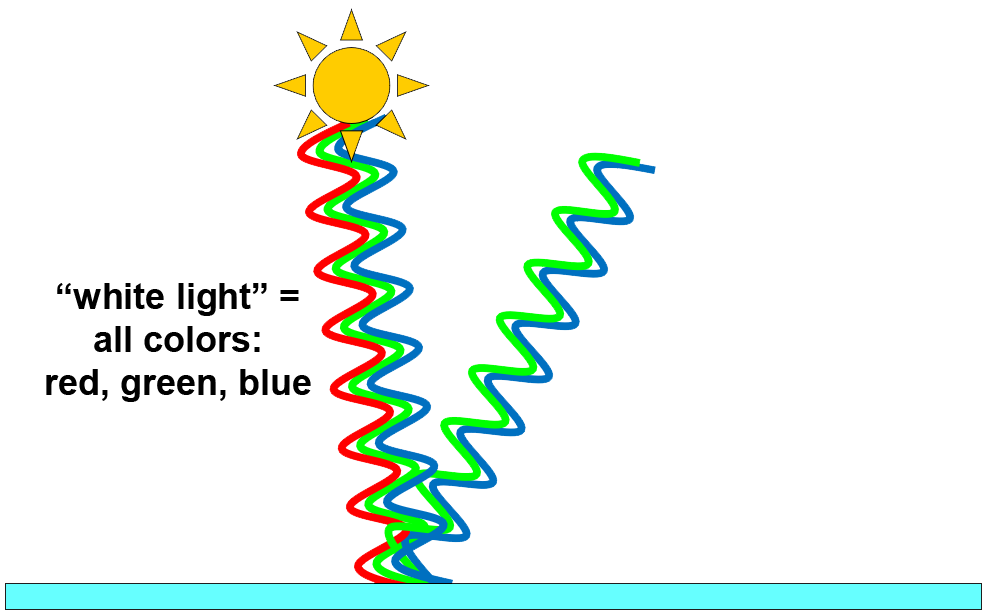
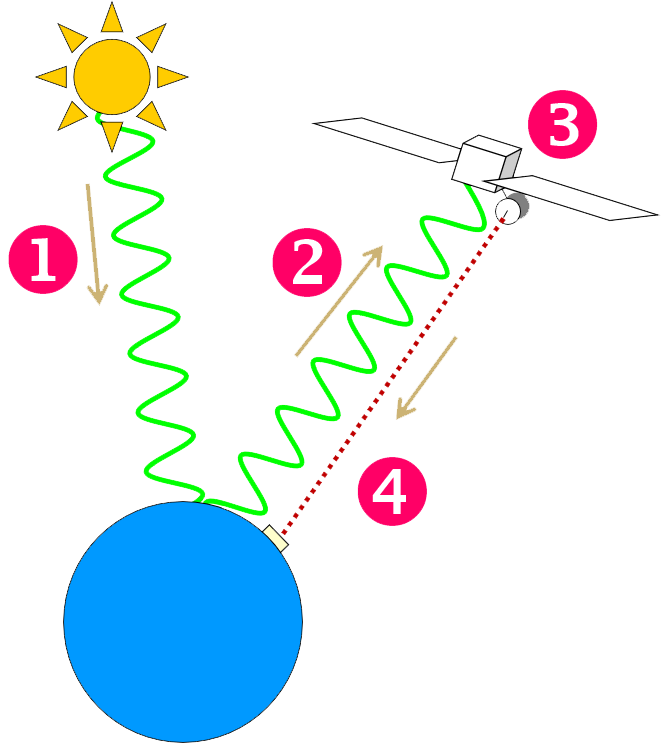
Whether looking at the Earth or elsewhere, all satellite-based remote sensors function on the principal of reflectivity. All of the Earth’s external energy comes from the Sun. Not all of the radiation from the Sun reaches the Earth’s surface. The thin blanket of gas surrounding us, the atmosphere, absorbs or reflects much of it. The rest is differentially absorbed and re-radiated or reflected by various surface features and atmospheric components. Satellite-based remote sensors detect such reflected radiation.
For a better understanding of remote sensing and reflected radiation, these information sheets offer greater details: Spectral Signature summarizes the nature of light and introduces reflectivity; Differential Reflectivity explains reflectivity and the resulting remotely-sensed satellite images; and Spatial Resolution describes the relationship between resolution, perspective, and the satellite's mission.
Selecting a data set in support of a specific research question may seem daunting at first. For example, take a look at a small selection of satellite-based remote-sensing products in Remote Sensing Products. One way to sort through so many available options is just pick an on-line access tool from 2 Accessing Data DRO and 3 Accessing Data Online Archives and start exploring! On the other hand, a little more information about the data themselves may make that exploration easier. Consider data format, processing level, and accessibility.
Many data are stored in HDF (hierarchical data format). HDF is a set of file formats and libraries designed to store and organize large amounts of numerical data. It is currently developed and supported by the not-for-profit HDF Group. NASA selected HDF as its standard for data storage in 1993. NOAA’s National Oceanic Data Center provides data in NetCDF which is similar to HDF. Many commercial and non-commercial platforms support the use of HDF including Java, MATLAB, IDL, and Python. The most recent version, HDF5, simplifies the file structure to only two major object types: data sets (multidimensional arrays of the same type) and groups (containers that can hold data sets and other groups). It is not difficult to display and analyze data stored in HDF with an appropriate software platform. MATLAB is a frequent platform of choice for universities, government agencies, and research laboratories, but complexity and cost put it generally out of reach for most K-12 teachers.
Alternatives to MATLAB include MultiSpec (a no-cost software solution) and providing data in easier to use formats. MultiSpec is easy to learn, easy to use, and it will read many HDF files. This software package is detailed in 4 Visualizing Analyzing.
NOAA, NASA, and the USGS have adapted their on-line data access tools to deliver images in JPEG (Joint Photographic Network Group), PNG (Portable Network Graphics, a descendent of Compuserve’s GIF), KML (Google Earth’s Keyhole Markup Language), and several other formats less known to the K-12 audience. Each has an advantage over the other. GIF has high compression ratios but lacks high color definition. JPEG has lower, though adequate, compression ratios but maintains high color definition. PNG is a newer format that combines the best of both. Data downloaded in KML format can be displayed in Google Earth.
As you explore various data access portals listed in 3 Accessing Data Online Archives, you will also encounter THREDDS and OPeNDAP, NetCDF and ASCII. Thematic Real-time Environmental Distributed Data Services (THREDDS) and Open-source Project for a Network Data Protocol (OPeNDAP) are data retrieval frameworks used by many data archives. They offer data in Network Common Data Format (NetCDF) and American Standard Code for Information Interchange (ASCII). Both NetCDF and ASCII formats can be displayed using the software packages discussed in 4 Visualizing Analyzing but not as easily as the graphic formats (JPEG, PNG, KML) more familiar to K-12 learners.
NASA’s Earth Observing System Data and Information System (EOSDIS) data products are processed to various levels ranging from Level 0 (raw data at full instrument resolution) to Level 4. At higher levels, the data are converted into more useful formats that include error correction and interpolation of missing data pixels. The levels are summarized Levels of Data Processing. The advantage of time series data versus single-frame images and metadata are also discussed in Levels of Data Processing. As more agencies recognize and apply these processing levels, there is greater consistency between the data available from different agencies. Most of the remote sensing products K-12 learners will encounter are Level 2 or Level 3, and some may be Level 4.
There are many sources for near real-time and archived data sets available. Public agencies such as NOAA, NASA, and the USGS offer free access to data and imagery. In recent years, these same agencies have put considerable effort into making data images available in forms more easily accessed and understood by the general public. Data access and use in educational settings is encouraged. Refer to 3 Accessing Data Online Archives for on-line access points "how-to" tips, tutorials, and sample lesson plans for data access portals. All of these data are available at no cost for access or use, and all have been processed to Level 2 or higher already. In 3 Accessing Data Online Archives you will find details about NASA's GIOVANNI, using Live Access Server at NASA Jet Propulsion Laboratory's Physical Oceanogrphy Distributed Active Archive (PO.DAAC) and My NASA Data, USGS GloVis, NOAA's NOAAView, NOAA's GOES Image Viewer, and links to dozens of other data access portals. GloVis provides access Landsat imagery on demand. NOAAView opens near real-time and historical imagery global and regional, of many remotely sensed parameters of the atmosphere, ocean and land in convenient image formats.
Have you ever tried to zoom in on a photograph taken with a digital camera or a mobile phone camera? If you zoom in close enough, the picture appears to become a series of rectangular blocks, and each one seems to be a different color. Each of those blocks is a separate picture element or pixel. When all of the elements of a single picture are viewed together arranged in a particular sequence of rows and columns, a recognizable image is formed. Among the many important components of remote sensors on satellites orbiting the Earth there is a digital camera that divides the picture it "sees" into such an array of picture elements.
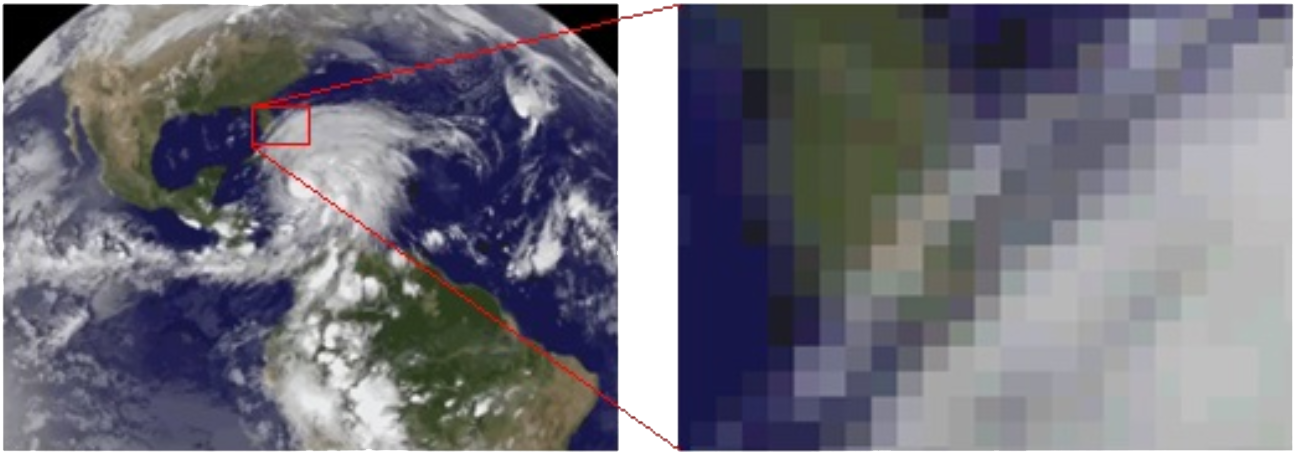
All satellite-based remote sensors send their information to receiving stations on Earth in digital data streams containing pixel information. Specialized software is used to interpret the data stream and convert it to an image representing what the remote sensor "saw." Each pixel is independently registered by the remote sensor and is recreated from the data stream in the digital image seen on the computer monitor. During image processing, the user can manipulate the appearance of the pixels on the screen to clarify selected portions of the image and the features shown therein.
The pixels are arranged in an array of columns and rows to duplicate what the remote sensor "saw." Each pixel has a location designation in the image similar to the row and seat number of each reserved seat in a sports stadium or theater. If one thinks of the image as a grid of X,Y coordinates, the column number is designated by the X coordinate and Y indicates the row number with the origin (0,0) in the upper left corner. The width of the image is the number pixels on the X axis; the height is the number Y axis pixels.
Each pixel has a pixel value or brightness value. Each pixel of the image independently registers the amount light detected for that pixel. For an 8-bit image, there are 256 possible brightness or light intensity values. Pixel value or brightness value is the number on that scale representing the intensity of the light detected for that pixel. A pixel value of 0 is black (no light detected) while a pixel value of 255 is white (maximum light detected). The 254 values between 0 and 255 are seen as shades of gray.
Since digital images are stored in binary bits of data, an 8-bit image can have 28 or 256 possible pixel values or shades of gray or colors. This is called bit-depth. Other bit-depths provide a greater number of pixel values or colors in an image:
Each digital image file includes metadata or data about the digital image data. Metadata includes the date of the image, size in pixels wide and high, and bit depth, among other things. Sometimes accessing metadata is as easy as examining the image file's properties with a computer.
Computer software designed to view digital images can create custom color palettes or lookup tables by assigning a specific color to each numerical pixel value. This information is stored in the viewing program. When the lookup table is overlaid on the image data, a false color image is displayed on the computer screen. The pixel value of each pixel remains unchanged in a false color image; the pixel value is just reinterpreted by the viewing program as a specific color for display purposes.
You are invited to explore these areas in sequence or skip to the topic of greatest interest:
Satellites & Orbits is an brief introduction to two major types of Earth-orbiting satellites and satellite orbits: polar and geostationary. Although there are hundreds of operational and decommissioned satellites in orbit around the Earth, the focus here will be on NOAA weather satellites as exemplars. The difference between these orbit types and the advantages of each for remote sensing Earth parameters is included.
Remote Sensing Basics is an brief introduction to remote sensing, digital imagery, and accessing remote sensing data.