

When remote-sensing image data are analyzed, underlying, perhaps hidden, facts are brought to light. Interpreting the data is telling the story revealed by those facts. Interpretation can be biased by the purpose of the investigation and the skill level of the investigator. See more about what teachers can do to help students engage reasonable scientific thinking to clariffy their interpretations.
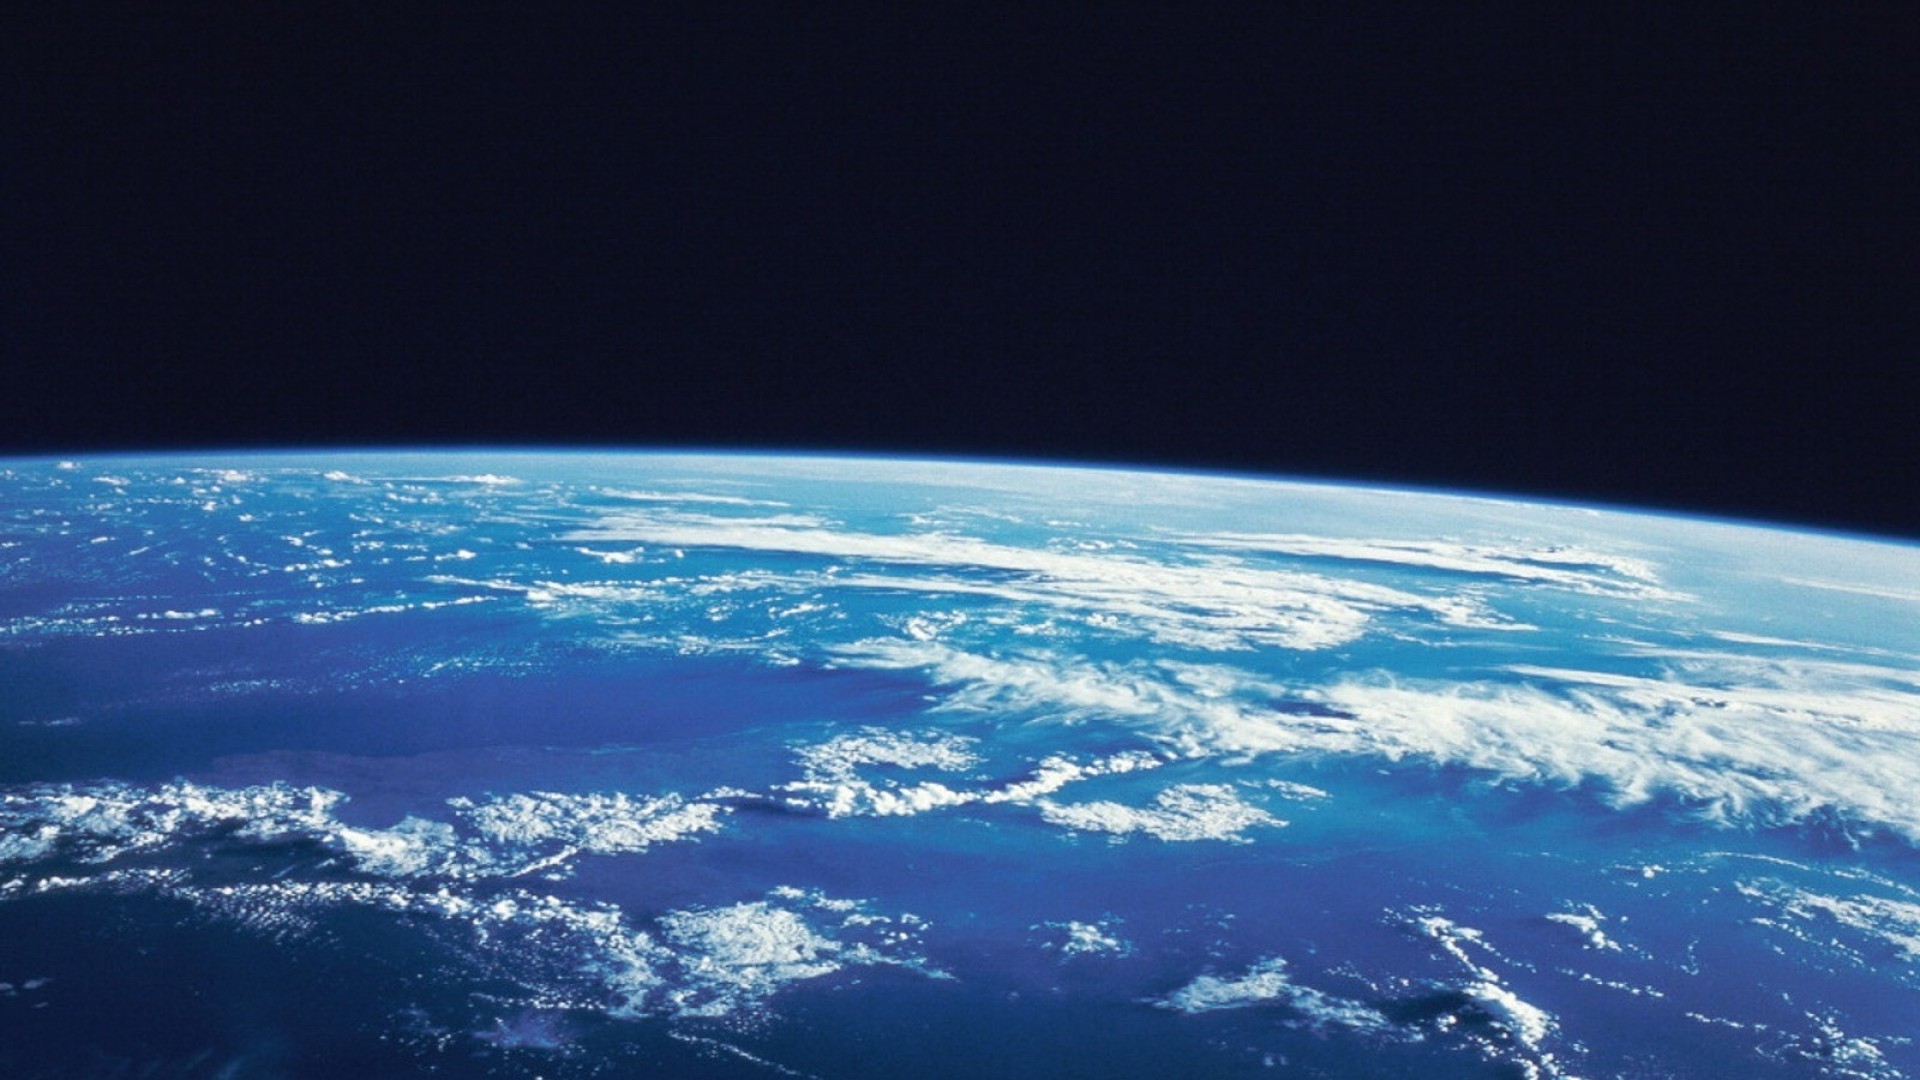
You are invited to step into the realm of man-made satellites and satellite-based remote sensing, how to access the data and use it to better comprehend our planet Earth and how we interact with it. Find here basic information about environmental satellites and using remote sensing data.
Follow with more in-depth looks at ways to access specific data, visualize and analyze them, then interpret and apply that knowledge to our Earth systems and human condition. Find applications for science, mathematics, engineering and technology, geography, and more. Presented at no cost by the Satellite Educators Association.
Learn to use highly effective, no-cost tools for visualizing and analyzing remote sensing data from environmental satellites. Access to many tools for visualization and/or analysis is here. Emphasis is on ImageJ, MultiSpec, ArcGIS Online for ease of student use.
Satellite Direct Read-Out — receiving and imaging signals directly from polar-orbiting and geostationary weather satellites has become much easier and very inexpensive. Build and operate your own weather satellite receiving station. See imagery in real-time.
Obtain archived and near real time remote-sensing data from environmental satellites about dozens of Earth parameters. The data are freely available from NOAA, NASA, USGS, and university archives. Learn to navigate the user interface of publicly accessible archives including NASA Worldview, NOAAView, GloVis, GIOVANNI, the GOES Image Viewer, and much more.