


Generally, there are two types of Earth-orbiting satellites named for their orbit types, geostationary or geosynchronous and polar. SciJinks has a helpful animated visualization of the orbital differences.
Geostationary satellites are typically used for communication, entertainment, and meteological observations — tasks for which the satellite is required to be visible at a seemingly fixed point in the sky as seen from various ground locations. The orbit is large and directly over the Earth's equator. The satellite travels in the same direction as the Earth's rotation and at a velocity that matches the Earth's rotation rate. From the Earth's surface, geostationary satellites appear to remain over the same ground location at all times.
The location of this orbit is called the Clarke Belt as it was first described in literature by science fiction author and scientist Arthur C. Clarke in 1945.
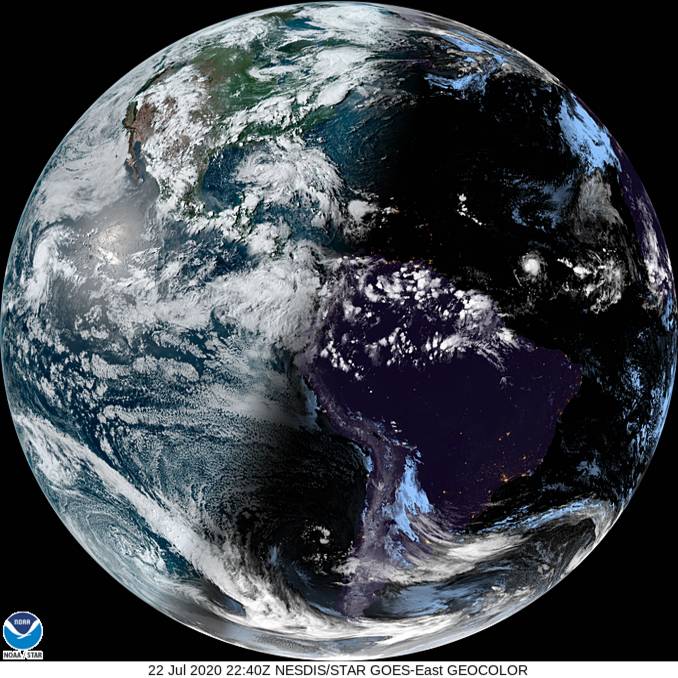
All geostationary weather satellites provide hemisphereical or "full disk" views such as this false-color image from GOES-East on July 22, 2020.
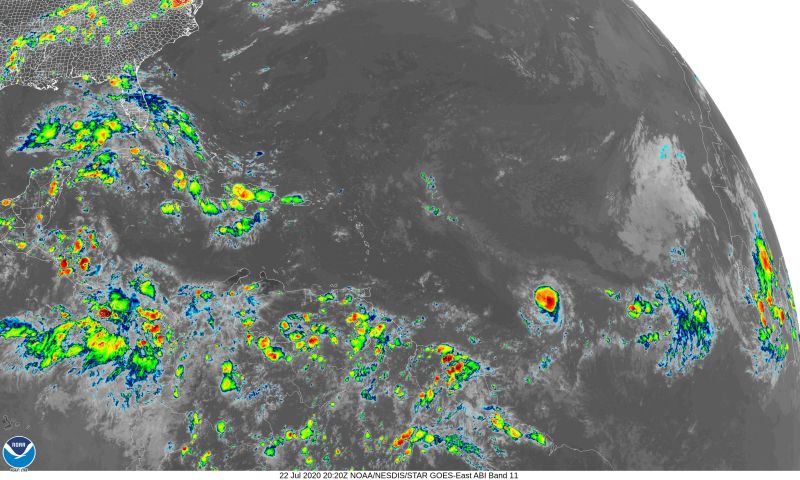
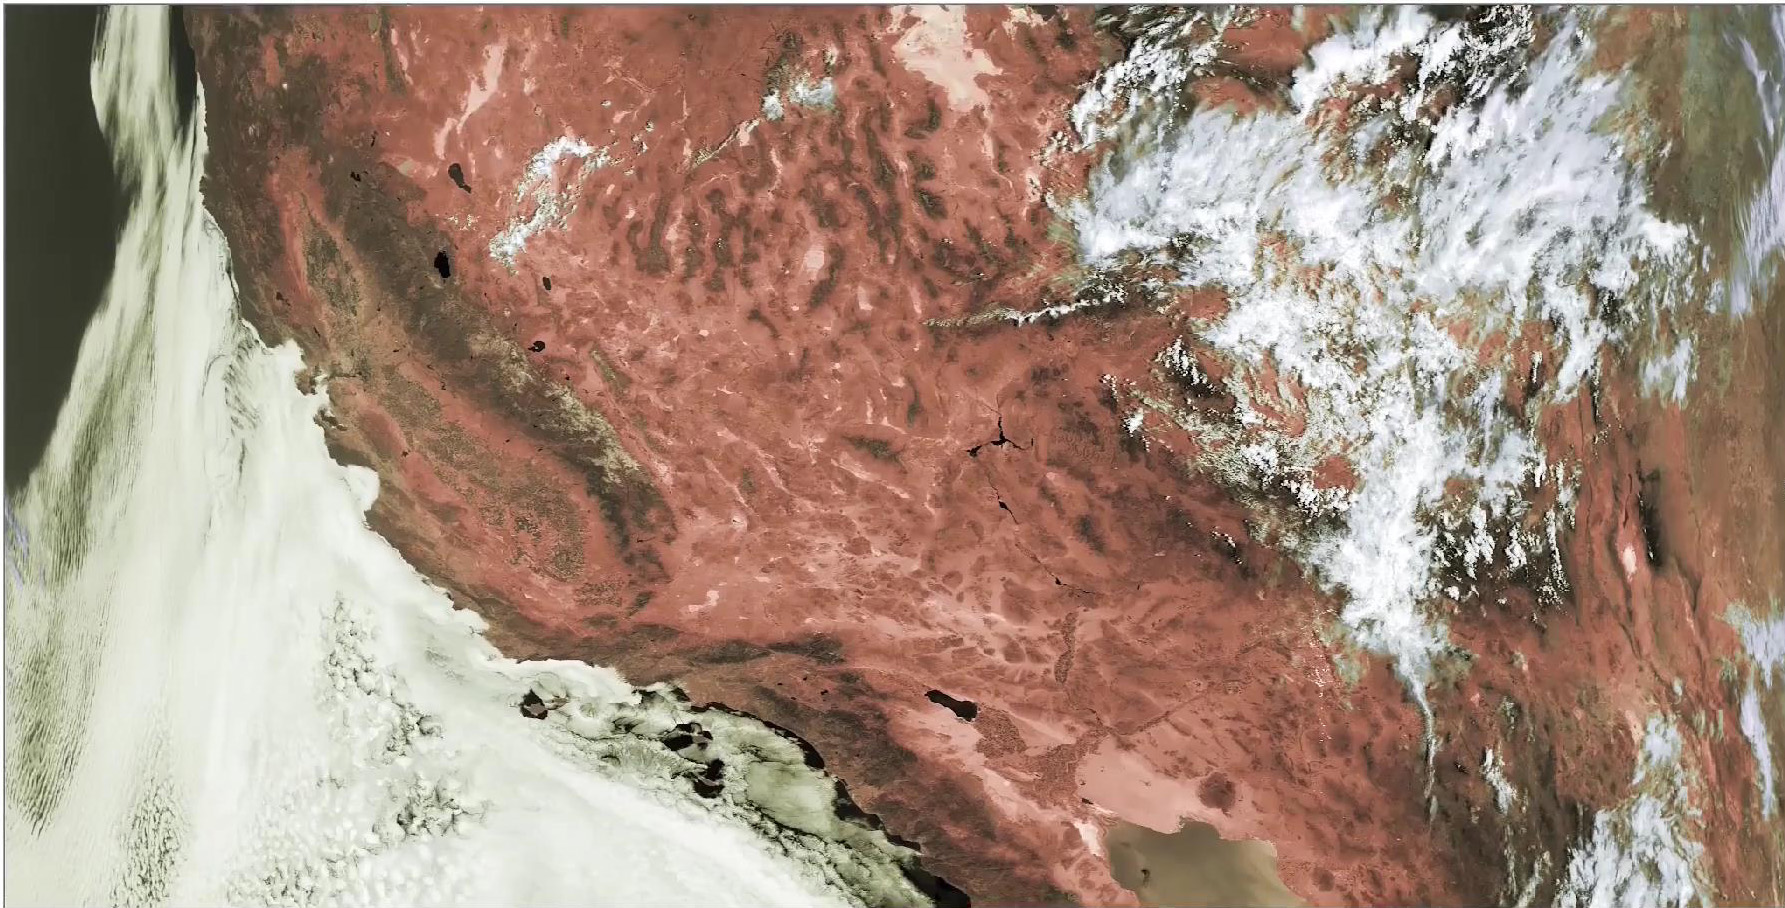
More advanced remote sensors on some, such as the Advanced Baseline Imager (ABI) on the GOES-R series satellites. The GOES-R series includes GOES-16 (GOES-East), GOES-17 (on-orbit backup), and GOES-18 (GOES-West). The ABI provides detailed data in sufficient wavebands to allow data processors to zoom-in on Earth quadrants and regions of special interest like the hurricane-producing sector of the North Atlantic ocean below. This image, showing the Tropical Storm Gonzalo developing on July 22, 2020, is from GOES ABI Band 11 (8.4μm), similar to the traditional longwave infrared band used to show cloud top temperatures.
Currently operational meteorological satellites have been placed in geostationary orbit by many countries around the globe.
This diagram illustrates the general high-interest regions covered by most of the above groups of satellites.
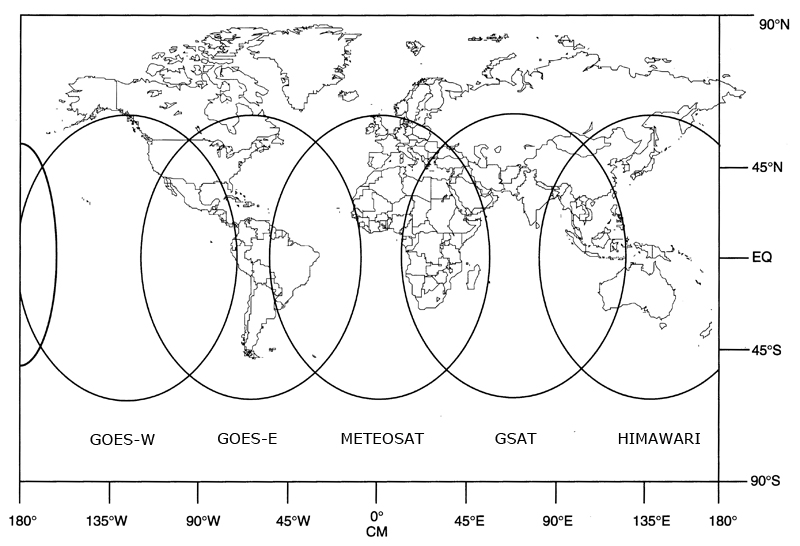
The illustration above highlights the significance of full global weather coverage and the existing spirit of international cooperation exercised by most countries in an effort to preserve life and property from catastropjoic damage during severe weather events.
The main advantage of meteorological monitoring from geostationary satellites is the global perspective afforded by remote sensors positioned a little more than 36,000 km (about 22,000 miles) from the Earth's surface. It is much easier to get the "big picture" even when zoomed-in on a specific region of interest. Even with technological advances allowing higher resolution imagery on a greater number of wavelength bands, the main advantage of remote sensors on satellites in geostationary orbit compared with those in polar orbit is still the broader view.
Polar-orbiting satellites are in low Earth orbit (LEO) at an altitude less than 2,000 km (1,200 mi). A "polar orbit" is inclined so the satellite does not pass directly over the poles. These satellites typically have orbital periods of 128 minutes or less resulting in at least 11 periods per day. NOAA
Here are just a few examples of low Earth orbit satellites and their uses:
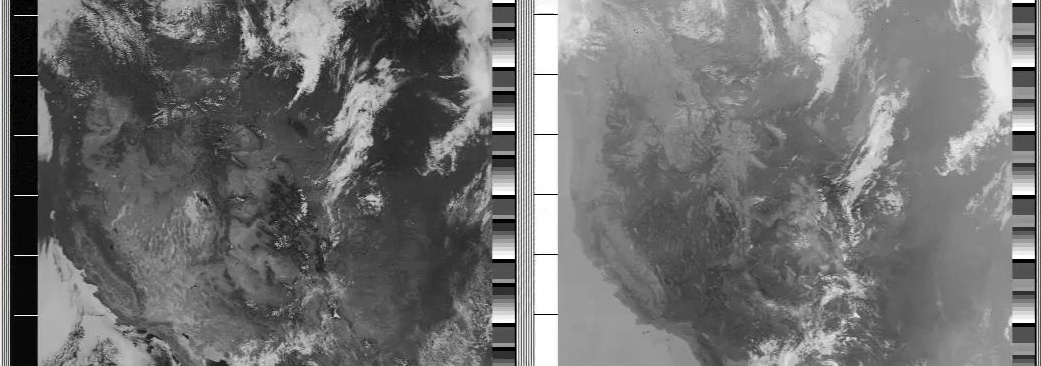
APT - The Polar Orbiting Environmental Satellites (POES) such as NOAA-18 and NOAA-19 included Automatic Picture Transmission (APT) capability transmitted in the 137.xx MHz range. APT is an older image format transmitted and received as a facsimile signal. Although the newer JPSS satellites do not include APT, the facsimile signal can still be received at home or in the classroom with fairly inexpensive equipment from NOAA-18 and -19. The APT facsimile image is a dual band image: visible wavelengths on one side (left in the sample image below) and thermal infrared on the other. Notice the border strips on each side of the sample images below. The gray-scale strip on one side is for pixel value calibration. On the other side of the image is a black (visible) or white (infrared) timing strip in which each line marks one minute. Spatial resolution is about 4 km per pixel on the ground.
HRPT - High Resolution Picture Transmission is a high-resolution alternative to APT available from the Advanced Very High Resolution Radiometer (AVHRR) on polar-orbiting weather satellites through NOAA-19. It is transmitted in the 1700 MHz range. Imagery has a 1.1 km resolution in five spectral bands. HRPT signals can still be received at home or in the classroom by industrious individuals on a budget.
The JPSS satelites carry newer, more advanced instruments replacing the long history of imagery from APT and AVHRR. For example, NOAA-20 includes the four instruments listed below.
The JPSS satellites such as NOAA-20 orbit at about 833 km (518 mi). The orbit is inclined 98.7° from the equator, and the satellites completes a single orbit in about 101 minutes. As the Earth rotates beneath the near polar-orbit, the satellite's view of the Earth surface advances longitudinally. In comparison, the POES satellites orbit at about 869 km (540 mi) in a path inclined 98.97° from the equator with an orbit period of about 102 minutes.
The orbit of such spacecraft is significant. Rather than flying directly over the geographic north and south poles, the orbit is tilted about 1.3° to one side of the poles. JPSS satellites travel at about 27,400 km per hour (17,000 mph) and an average altitude of 826 km (513 mi) in a slightly elliptical orbit. The orbit period is the time it takes for the satellite to pass from directly over the equator on an ascending node (traveling south to north), orbit once around the Earth and return to the equator on the next ascending node - that's just 101 minutes. This nearly polar orbit with this particular orbital altitude and period place JPSS satellites in a sun-synchronous orbit. That means the satellite passes over the same area of the Earth surface at the same local mean solar time each day. Being a U.S. satellite, NOAA-20 views all areas of the continental United States at about the same time each day during daylight hours.
Signals from NOAA polar-orbiting weather satellites can only be received when the satellite is "visible" to the receiver, that is, when there is a direct line-of-sight between the satellite and the receiving station on Earth. Once the satellite appears above the horizon, it will take about 15 minutes for it to pass overhead and disappear beyond the opposite horizon. Reception time may be considerably less depending on natural and artificial obstructions such as mountains, trees, and buildings that could block the signal.
Once a receiving station is constructed, users must be able to predict when the satellite will be "visible" to the receiving antenna. There are a number of orbital prediction programs available including those built into the receiving software available for home use. For a first look however, the easiest method, by far, is to simply visit the STAR ICVS site from NOAA NESDIS STAR. ICVS is Integrated Calibration/Validation System Long-Term Monitoring. When you visit ICVS, find the menu panel on the left and select "Spacecraft" under NOAA-21, NOAA-20, or their predecessor, Suomi NPP, to see the calculated orbital passes and their times such as in the ICVS screenshots below.
Polar-orbiting satellites have a smaller field of view during a much shorter time span than their geostationary counterparts. Nonetheless, they are closer to the Earth and offer more detailed views of surface features and atmospheric components. They require less energy to place into lower orbits and have a much shorter communications latency. With multiple orbit periods per day, these satellites provide data for a composite view of the entire Earth's surface every 3-4 days. This is a valuable asset for monitoring regional weather and climate issues (NOAA weather satellites) as well as many Earth resources (Landsat series).
You are invited to explore these areas in sequence or skip to the topic of greatest interest:
Satellites & Orbits is an brief introduction to two major types of Earth-orbiting satellites and satellite orbits: polar and geostationary. Although there are hundreds of operational and decommissioned satellites in orbit around the Earth, the focus here will be on NOAA weather satellites as exemplars. The difference between these orbit types and the advantages of each for remote sensing Earth parameters is included.
Remote Sensing Basics is an brief introduction to remote sensing, accessing remote sensing data, and digital imagery.